Competition task
The goal of the challenge is to locate ancient Maya architectures (buildings, aguadas and platforms) by performing integrated image segmentation of different types of satellite imagery (from Sentinel-1 and Sentinel-2) data and aerial laser scanning data (lidar data).
Comeptition platform
Data description
The main study area is a region around Chactún, Mexico - one of the largest known Maya urban centers located in the central lowlands of the Yucatan peninsula. The area is characterized by low hills with constructions and surrounding seasonal wetlands (bajos). Chactún is located in the northern sector of the depopulated Calakmul Biosphere Reserve in Campeche, Mexico, and is completely covered by tropical semi-deciduous forest. Its urban core, composed of three concentrations of monumental architecture, has a number of plazas surrounded by temple pyramids, massive palace-like buildings, and two ball-courts. A large rectangular water reservoir lies immediately to the west of the main groups of structures. Ceramics collected from the ground surface, the architectural characteristics, and dated monuments, indicate that the center started to thrive in the Preclassic period, reaching its climax during the Late Classic (cca. A.D. 600–1000), and had an important role in the regional political hierarchy.
Get the data
Due to storage constraints we will provide to the input data to all cometitors, seprately. Please fill-in this form and we will send you the neceserary details for obtaining the data.
Dataset example
The dataset consists of tiles derived from of Sentinel-1, Sentinel-2, and ALS (lidar) data, and associated annotation masks. Each tile measures 240 x 240 meters and has spatial resolution of 10 meters for Sentinel data and 0.5 meters for ALS data. The Sentinel-1 and Sentinel-2 data for each tile is stored separately in multi-band TIFF files (see data structure).
Sentinel-1 dataset: Level-1 Ground Range Detected (GRD) products of IW acquisition mode were acquired, for ascending and descending orbit, with two polarizations (VV and VH), and Sigma0 as backscatter coefficient. Values of backscatter coefficient were converted to decibels (dB), fitted to [-30, 5] dB interval and normalized to interval [0, 1]. Then, multiple temporal statistics were calculated for each tile: mean, median, standard deviation, coefficient of variance, 5th, and 95th percentile, pixel-wise for each year separately (2017, 2018, 2019, 2020) and for the whole period (2017-2020). Each Sentinel-1 TIFF file consists of 120 bands (5 x 60 bands; 24 by 24 pixels; float).
Sentinel-2 dataset: Level-2A products were acquired with reflectance data from 12 spectral bands (B01, B02, B03, B04, B05, B06, B07, B08, B8A, B09, B11, B12). All bands were resampled to 10 meter resolution. Due to geographical and climate characteristics of the test area in central Yucatan peninsula (frequent small convective clouds or haze), a cloud mask was calculated for each acquisition date. Acquisition dates with cloud cover above 5% were excluded. There are 17 valid acquisition dates in the period from 2017-2020 with 12 spectral bands and a cloud mask for each date. In total, each TIFF file therefore consists of 221 bands (17 x 13 bands; 24 by 24 pixels; float).
ALS (lidar) dataset: ALS data is provided in the form of a visualization composite consisting of sky-view factor (band 1), positive openness (band 2) and slope (band 3) in separate bands. The tiles coincide with Sentinel tiles and therefore have 480 by 480 pixels (3 bands, 8-bit).
Annotation masks: separate masks for buildings, platforms and aguadas (480 by 480 pixels, 8-bit, 0 feature present, 255 not present).
Model output
The output of the models will be prediction of the segmentation masks for each tile in the test set. In particular, for each tile, one has three masks, one for each of the classes of man-made structures – buildings, platforms, and aguadas. These are all binary masks, where black pixels depict the presence of a structure of the selected class, and white pixels correspond to absence of any structures of that class, at some position.
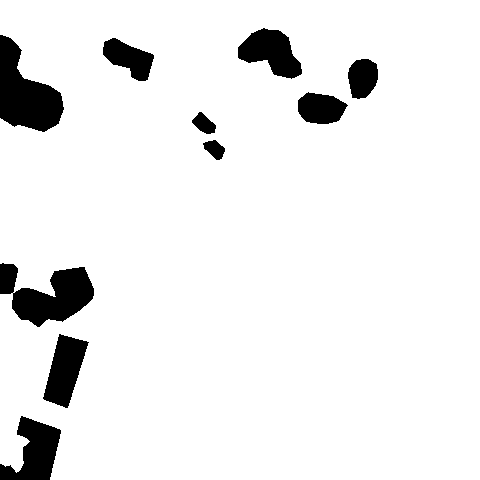
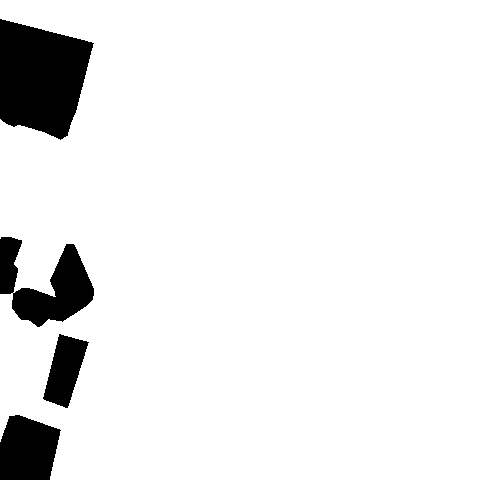
An example of masks for tile_44 for (left to right) aguada, building and platform.

Evaluation
The submissions will be evaluated using standard measures for estimating the quality of image segmentation methods. In particular, the predicted segmentation masks will be compared to the ground-truth masks using Intersection Over Union (IoU) score. The IoU score, also referred to as critical success, evaluates the overlap between the predicted segmentation mask and the ground-truth, or in other words the ratio of correctly predicted regions among the predicted regions.
The submissions will include prediction of the segmentation masks for each tile in the test set. For each tile, the solutions should include three masks, one for each of the classes of structures – buildings, platforms, and aguadas. Each submisssion will be evaluated using the average IoU score between the submitted predictions and the ground-truth masks. More specifically, each submission will be evaluated with 4 different average Intersection Over Union (IoU) scores, one for each class of structures and one computed on all predictions. The winning solutions will be determined using the overall average IoU score.
The challenge will also have two separate leaderboards - a private and a public leaderboard (available at the platform). The former will rank the solutions on the complete test dataset, and the potential winners will be determined solely by this ranking - available once the competition has ended. During the competition period, the current ranking will be visible on the public leaderboard, computed on a subset of the test dataset. The best performing solutions from each competitor (that are better than the baseline) on the public leaderboard will be further evaluated for the private leaderboard thus determining the winner.
Submission format
Submissions should of a single zip file consisting of prediction of the 987 segmentation masks for each of 329 tiles in the test dataset. In particular, for each tile, the solutions should include three masks, one for each of the classes of structures – buildings, platforms, and aguadas. Make sure to zip the files directly, without extra directories within the zip bundle.
These are all binary masks (8-bit, 0-value feature present in pixel, 255-value empty pixel), where black pixels depict the presence of a structure of the selected class, and white pixels correspond to absence of any structures of that class, at some position.
Due to storage limitation each masks should be provided as a separate .npz file (numpy zipped archive) that includes a Compressed Sparse Row boolean matrix with ‘True’ values denote pixels with the presence of a structure, and ‘False’ values otherwise. Each .npz should have the following file name:
‘tile_number_mask_type.npz’
where number denotes the tile number (an integer in the range of 1765 to 2093) while type denotes the type of structure which can be either aguada, building or platform. For example, files named ‘tile_1777_mask_building.npz’ and ‘tile_2090_mask_aguada.npz’ are valid submissions, but ‘1777_platform.npz’ or ‘Tile_building_3400.npz’ are not.
A code snippet for converting a .tif binary mask (8-bit, 0 feature present in pixel, 255 empty pixel) to a valid boolean-matrix .npz file is :
from scipy import sparse
from PIL import Image, ImageOps
import os

def convert_image(img_path):
    img=Image.open(img_path)
    return sparse.csr_matrix(ImageOps.invert(img),dtype=bool)

for file in os.listdir('predictions'):
    fname=os.path.join('predictions/', file)
    sparse.save_npz(os.path.splitext(fname)[0]+'.npz', convert_image(fname), compressed=True)
Baselines
- Default Baseline (submission with empty masks) : submitted by simidjievskin on April 2nd, 2021 with Avg IoU performance 0.5745 [avg IoU aguadas 0.9634; avg. IoU of buildings 0.4268; avg IoU of platfroms 0.3333]
- DeepLabV3 Baseline - submitted by kostovskaa on April 3nd, 2021 with Avg IoU performance 0.76787 [avg IoU aguadas 0.98478; avg. IoU of buildings 0.66005; avg IoU of platfroms 0.65877]: Deeplabv3-ResNet101 is constructed by a Deeplabv3 model (Chen et al. 2017) with a ResNet-101 backbone. The pre-trained model has been trained on a subset of COCO train2017, on the 20 categories that are present in the Pascal VOC dataset. The model has been fine-tuned using only lidar data.
Acknowledgement of data collection and preparation
ALS data acquisition was financed by the KJJ Charitable Foundation, presided by Ken and Julie Jones (USA) and The Chactún Regional Project: Study of an Archaeological Landscape in the Central Maya Lowlands (ARRS project J6-7085; 2016-2018). Data processing was further financed by research programs Anthropological and Spatial Studies (ARRS P6-0079; 2015-2021) and Earth Observation and Geoinformatics (ARRS P2-0406; 2019-2024) and by the project AITLAS:Artificial Intelligence Toolbox for Earth Observation (cont.4000128994/19/D/AH, ESA, 2020-2021).